HSBC MPF SuperTrust Plus vs. Manulife Global Select: FER & US Equity Showdown
Hong Kong's two largest MPF schemes head to head on live MPFA data (31 Oct 2026): HSBC's 0.82% US/Global equity trackers vs. Manulife's 1.73%–1.74% active flagship equity funds on 5Y returns and 20-year fee drag.
Last verified: 2026-11-20 · Official policy wordings and trustee disclosures always prevail.
Key Takeaways
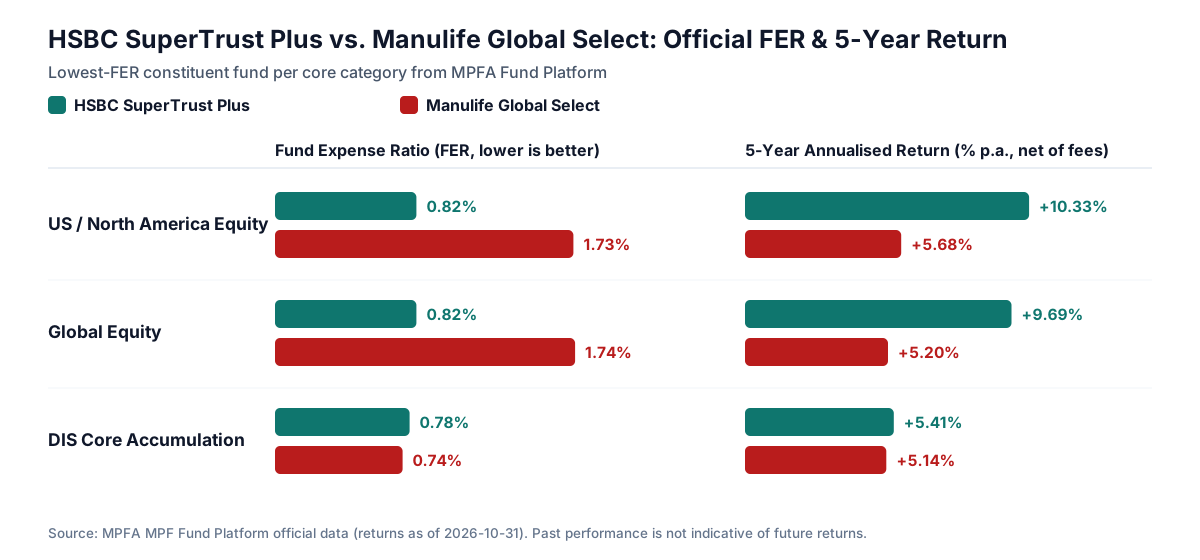
- Stark US equity gap: HSBC ValueChoice North America Equity Tracker charges 0.82% FER (5Y 10.33% p.a.) vs. Manulife MPF North American Equity at 1.73% FER (5Y 5.68% p.a.) — 0.91% higher annual fee with 4.65% p.a. lower 5-year return.
- Same spread in Global Equity: HSBC Global Equity (0.82% FER, 5Y 9.69%) vs. Manulife International Equity (1.74% FER, 5Y 5.20%).
- Members locked into Manulife via a current employer can mitigate drag using the ≤0.95% DIS Core Accumulation Fund inside the scheme plus annual ECA transfers of employee contributions.
Visual Comparison
Clause-by-Clause Matrix
0.77% – 2.05%
0.74% – 1.91%
ValueChoice North America Equity Tracker Fund (FER 0.82% · 5Y 10.33%)
Manulife MPF North American Equity Fund (FER 1.73% · 5Y 5.68% · 10Y 11.09%)
Global Equity Fund (FER 0.82% · 5Y 9.69%)
Manulife MPF International Equity Fund (FER 1.74% · 5Y 5.20% · 10Y 9.50%)
Core Accumulation Fund (FER 0.78% · 5Y 5.41% · 10Y 6.89%)
Manulife MPF Core Accumulation Fund (FER 0.74% · 5Y 5.14%)
All 20 constituent funds tracked directly from the official MPFA Fund Platform (as of 2026-10-31). · FER spans 0.77%–2.05% (avg 1.13%), alongside statutory fee-capped DIS funds.
All 29 constituent funds tracked directly from the official MPFA Fund Platform (as of 2026-10-31). · FER spans 0.74%–1.91% (avg 1.38%), alongside statutory fee-capped DIS funds.
FER can vary by more than 1% p.a. between index/DIS funds and active equity funds within the same scheme. · Consolidating or transferring via ECA involves a brief out-of-market cash settlement window.
FER can vary by more than 1% p.a. between index/DIS funds and active equity funds within the same scheme. · Consolidating or transferring via ECA involves a brief out-of-market cash settlement window.
| Clause-by-Clause Matrix |  HSBC Mandatory Provident Fund - SuperTrust Plus |  Manulife Global Select (MPF) Scheme |
|---|---|---|
| Constituent Fund Classes | 20 | 29 |
| FER Range (Lowest – Highest) | 0.77% – 2.05% | 0.74% – 1.91% |
| Simple Average FER | 1.13% | 1.38% |
| Lowest-FER US / North America Equity | ValueChoice North America Equity Tracker Fund (FER 0.82% · 5Y 10.33%) | Manulife MPF North American Equity Fund (FER 1.73% · 5Y 5.68% · 10Y 11.09%) |
| Lowest-FER Global Equity | Global Equity Fund (FER 0.82% · 5Y 9.69%) | Manulife MPF International Equity Fund (FER 1.74% · 5Y 5.20% · 10Y 9.50%) |
| DIS Core Accumulation Fund | Core Accumulation Fund (FER 0.78% · 5Y 5.41% · 10Y 6.89%) | Manulife MPF Core Accumulation Fund (FER 0.74% · 5Y 5.14%) |
| Key Strengths | All 20 constituent funds tracked directly from the official MPFA Fund Platform (as of 2026-10-31). · FER spans 0.77%–2.05% (avg 1.13%), alongside statutory fee-capped DIS funds. | All 29 constituent funds tracked directly from the official MPFA Fund Platform (as of 2026-10-31). · FER spans 0.74%–1.91% (avg 1.38%), alongside statutory fee-capped DIS funds. |
| Watch-outs | FER can vary by more than 1% p.a. between index/DIS funds and active equity funds within the same scheme. · Consolidating or transferring via ECA involves a brief out-of-market cash settlement window. | FER can vary by more than 1% p.a. between index/DIS funds and active equity funds within the same scheme. · Consolidating or transferring via ECA involves a brief out-of-market cash settlement window. |
CoverHK · HSBC MPF SuperTrust Plus vs. Manulife Global Select: FER & US Equity Showdown
Want a tailored clause check or exact numbers?
Share your age band, existing corporate medical cover, or current MPF trustee — we will reply in writing with a clear side-by-side summary.